HDDP: Health Data Playground
How I built a health-data playground that lets designers work with real biosignals, no electronics background needed
Designers are told to design for health, then handed a CSV of heart rates and left alone.
Solo build for a research group: the platform, the sensor-kit and dataset models, the in-browser visualiser, and the admin layer behind it.
Role
Designer and Builder
Category
Vibe Coded · Research Platform
Timeline
2026
3
Live datasets: HRV, heart rate and sleep
0
Setup needed to visualise a file
CSV
Upload your own data and chart it
HvA
Built for the Digital Life Research Group
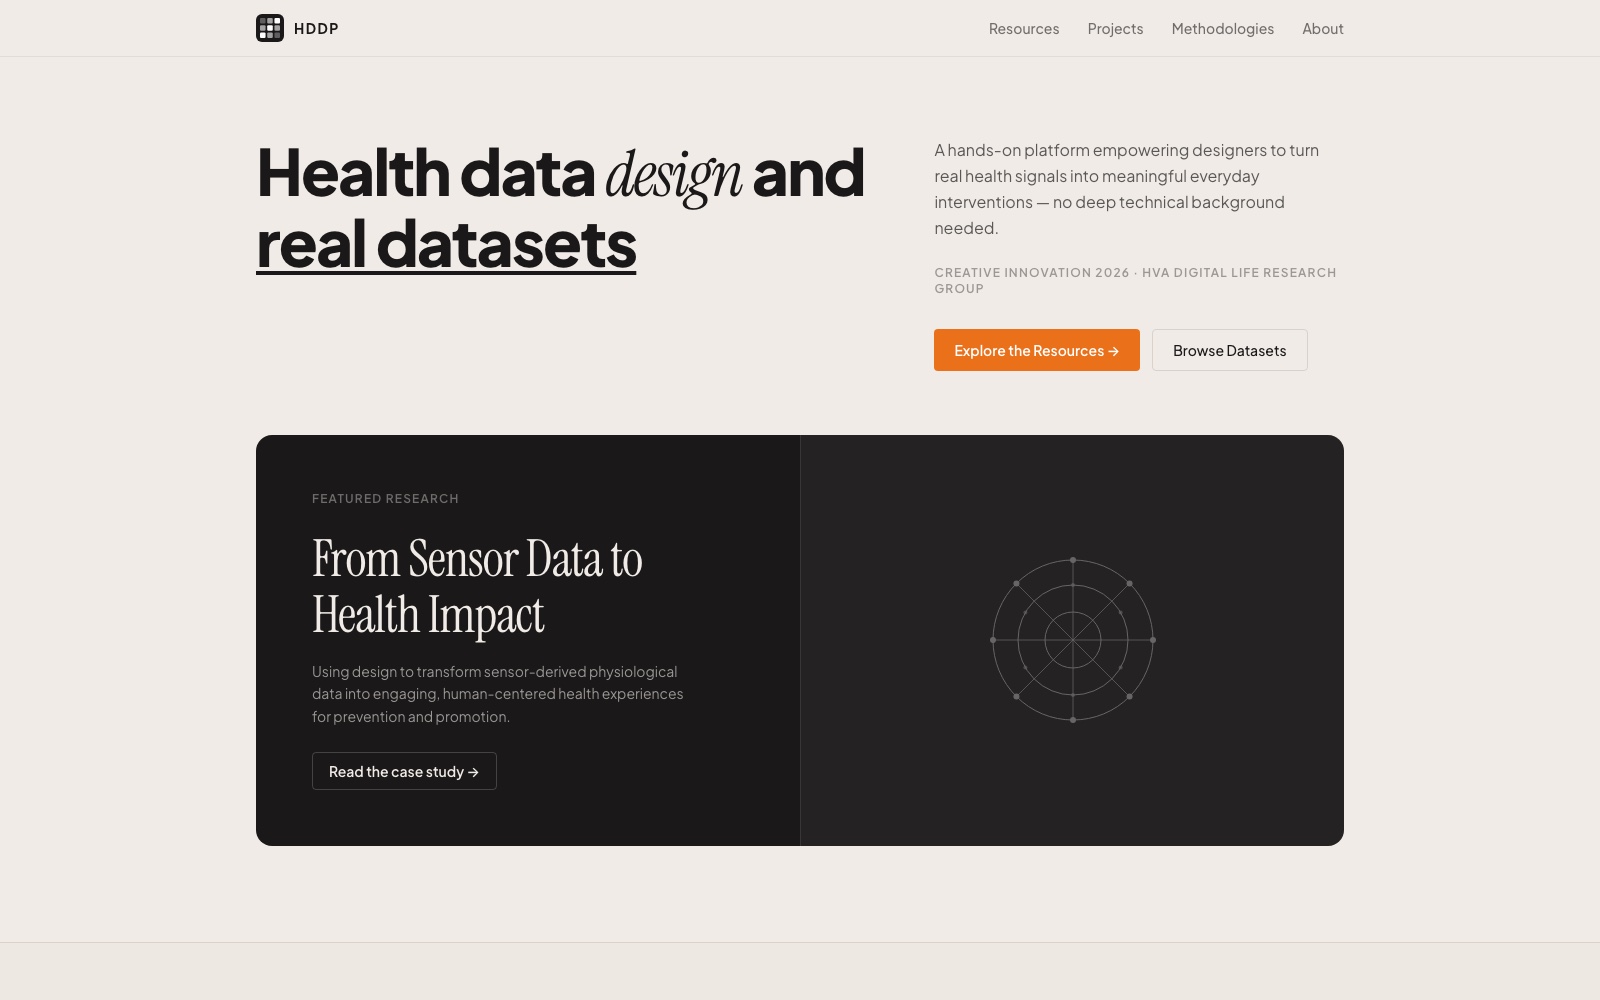
“A hands-on platform empowering designers to turn real health signals into meaningful everyday interventions.”
From the platform's home page
Overview
The contextHDDP, the Health-Data-Design Playground, is a platform for the HvA Digital Life Research Group. It exists so design students and researchers can work with real physiological data, heart-rate variability, sleep, skin response, without first becoming electronics engineers.
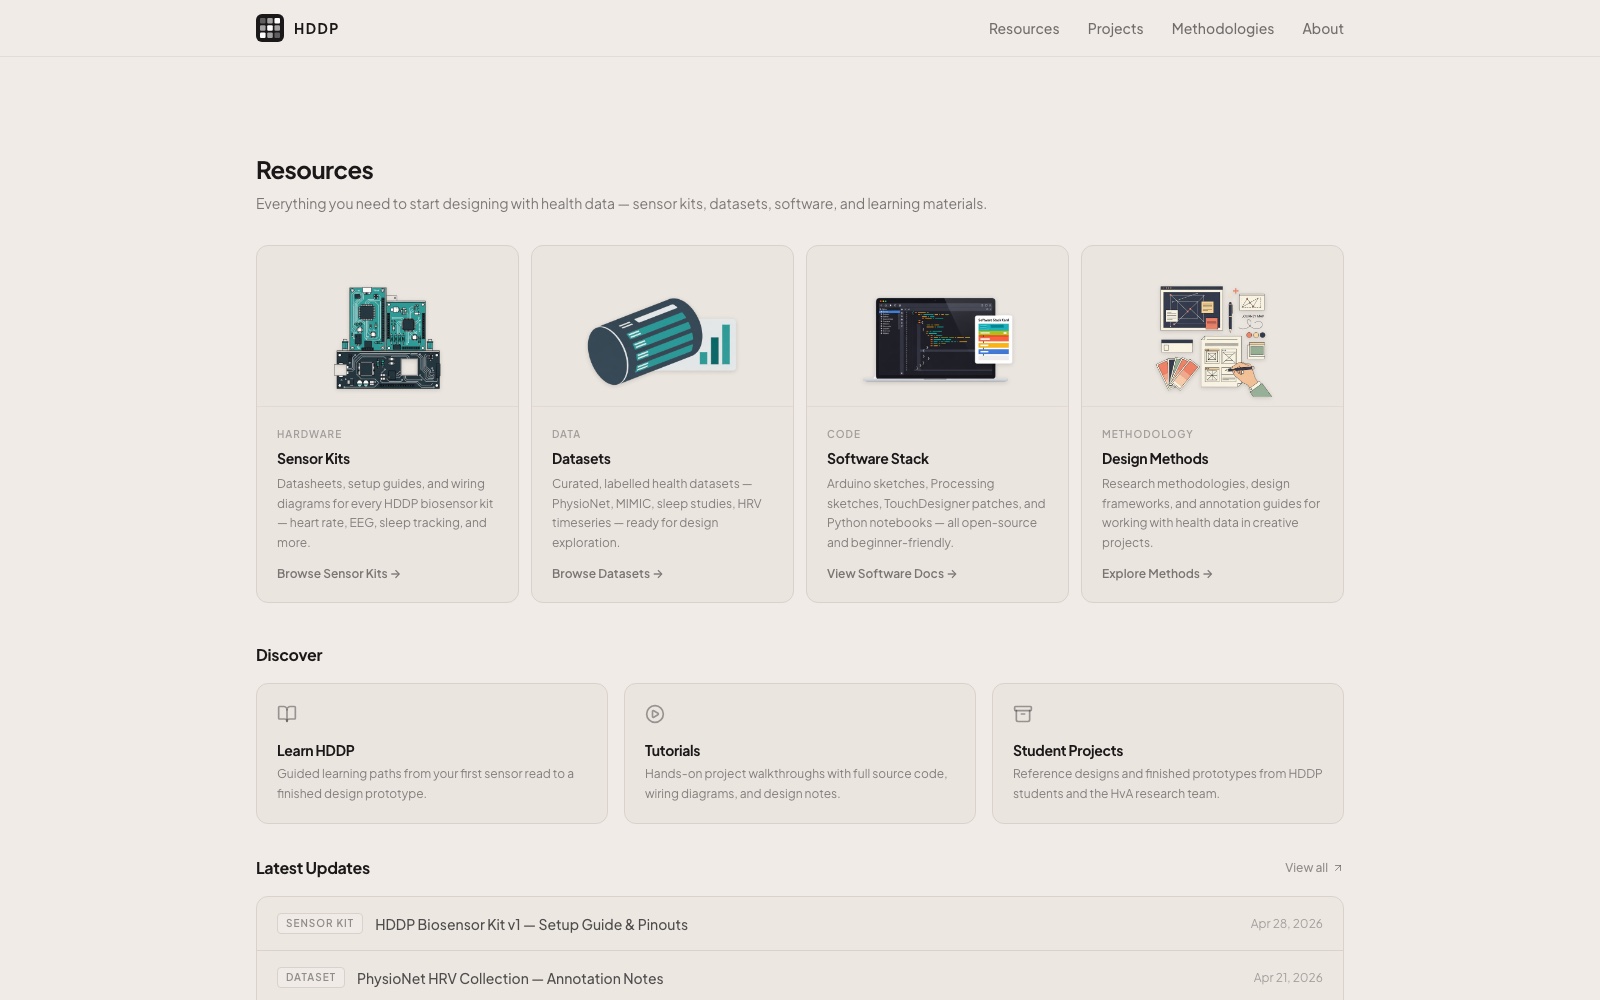
It pairs modular biosensor kits with real recorded datasets, and lets you open any file and see it charted in the browser. Around that sit case studies, methodologies and tutorials, so the data arrives with context rather than as a folder of CSVs.
Challenge
The problemHealth data is unusually hard to design with, and almost none of the difficulty is about design:
The setup cost comes first
Before a designer can look at a single heartbeat they need a sensor, a wiring diagram, firmware and an export pipeline. Most give up before the data exists.
Raw signal is not evidence
A file of R-R intervals in milliseconds tells you nothing until it is charted. Without a visualiser, the dataset is a wall.
Kits and data live apart
Hardware guides live in one place, sample recordings in another, and the method for interpreting them in a third. Nothing points at anything else.
Licensing is easy to get wrong
Health datasets carry real constraints, and students publishing work need to know which ones apply before they use a file.
The core problem: collapse the distance between a sensor on a wrist and a chart a designer can reason about, without asking them to build the pipeline first.
Approach
The processShip kits, not parts lists
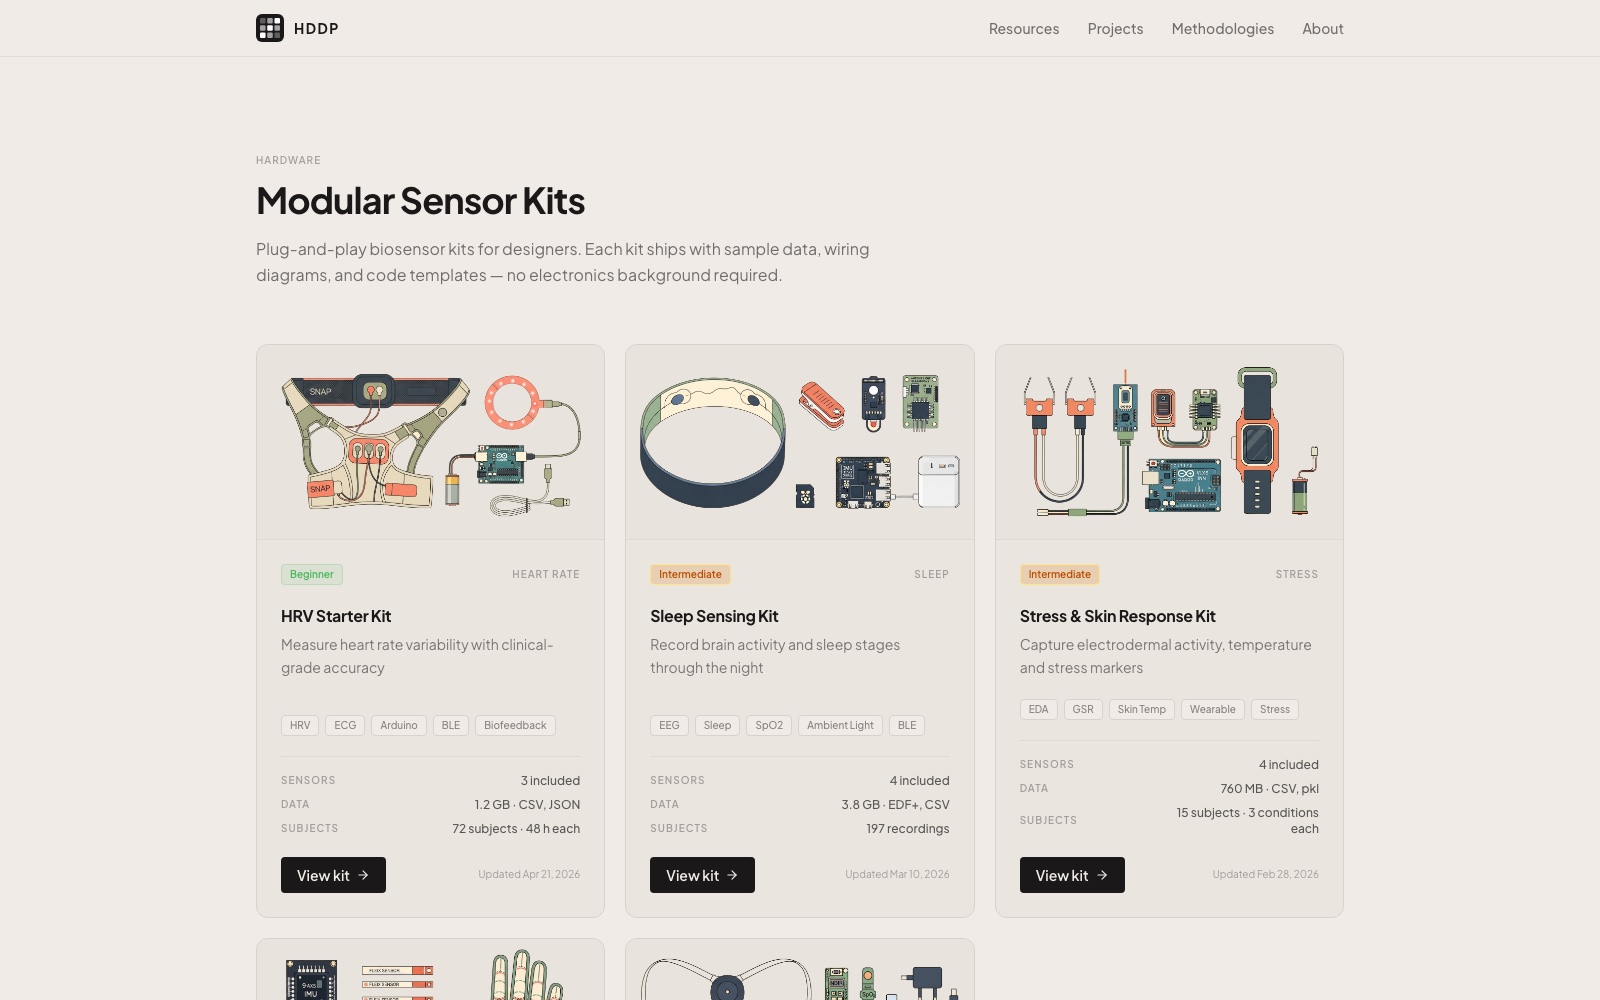
Five modular kits, from an HRV starter to sleep, stress, motion and breathing, each labelled with a difficulty level and listing its sensors, data volume, formats and how many subjects the sample covers.
Make every dataset openable
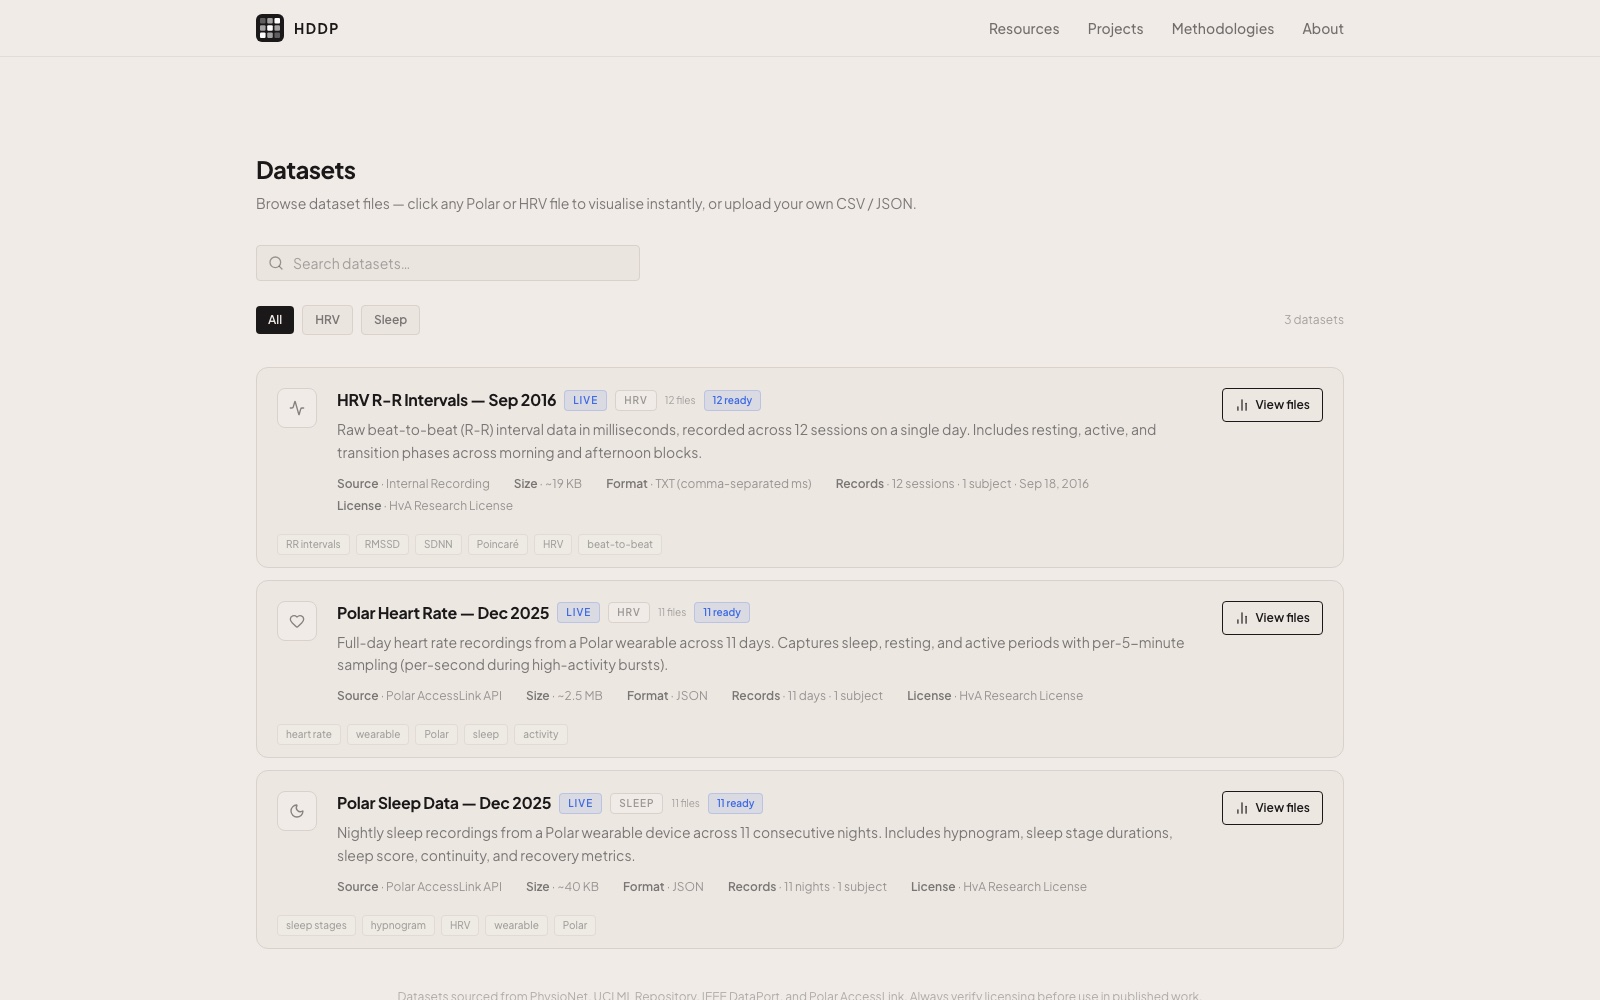
Datasets are browsable with their source, size, format, record count and licence on the card. Any HRV or Polar file charts instantly in the browser, and people can upload their own CSV or JSON to see it the same way.
Put method next to material
Case studies and methodologies sit alongside the kits and data, so the question is not only what the signal is but what has been done with it before.
State the licence up front
Every dataset card carries its licence and origin, with a standing reminder to verify before publishing, because the alternative is students finding out too late.
Give the research group a way in
An admin layer with team, community and event management means the group can keep the playground current without going back to the code.
Outcome
The resultThe platform turns a stack of prerequisites into a browsable resource:
Five kits with real specs
each one says what it measures, what it ships with, and how hard it is to get running.
Three live datasets
HRV intervals, full-day heart rate and eleven nights of sleep, all openable rather than merely downloadable.
Instant visualisation
click a file, or upload your own CSV or JSON, and see it charted without installing anything.
Context that travels with the data
case studies, methodologies and tutorials sit beside the kits, so a dataset arrives with a way to think about it.
The interesting realisation was that the hardest part of designing with health data is not the design or the data. It is the twenty steps in between, and most of them can be removed by a website.
Key learnings
What I took awayRemove the setup, not the complexity, designers did not need simpler data, they needed to stop building pipelines before they could see any.
A dataset is only real when it renders, click-to-visualise changed a file from something to download into something to think with.
Put the licence on the card, surfacing constraints where the data is chosen stops students discovering them after publishing.
Kits beat components, packaging sensors with sample data and a difficulty level let people start at their actual level instead of guessing.
More projects
Lulu Bank: AI Banking App
AllpdfTools: PDF Workspace
Contact me
Let's work together
Have a project in mind, or just want to say hi? I'm always open to new conversations.